




TuringSpace

Grounding Spatial Intelligence in Action
with Interactive CAPTCHAs

Xuwei Ding1*Skylar Zhai2*Linxin Song3Jiarui Feng4Dongqi Fu4Huajun Xi5 Junnan Li6Jingcheng Liang2Jieyu Zhao3Yinglong Xia4Hong Li4Jian Kang5
1University of Pennsylvania2University of Minnesota, Twin Cities3University of Southern California4Meta
5Mohamed bin Zayed University of Artificial IntelligenceMBZUAI6University of Wisconsin–Madison
*Equal contribution
University of Pennsylvania University of Minnesota University of Southern California Meta Mohamed bin Zayed University of Artificial Intelligence University of Wisconsin–Madison
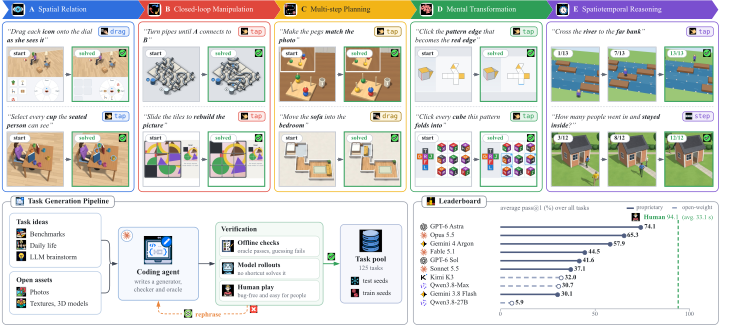
Two example tasks per category with their start and solved states, the task generation pipeline, and a leaderboard in which humans reach 94.1 percent and GPT-6 Astra 74.1 percent
125 interactive spatial CAPTCHAs in five abilities (top), each a program written by a coding agent and checked by programs, model play-throughs and human players before it enters the pool (bottom left). Humans solve 94.1%; the best model, GPT-6 Astra, 74.1% (bottom right).

Frontier MLLMs pass up to 96% of conventional CAPTCHAs, yet fall far behind humans on interactive spatial ones.

94.1vs74.1

pass@1 (%) of humans andthe best model, GPT-6 Astra

≤ 3.5%

best pass@1 of GUI agents,even CAPTCHA-trained ones

57.1%

of top-model failures comefrom misreading the screen

7.5%

of failed open-model attemptsever drop their wrong belief

1.6→33.1

pass@1 (%) of Qwen3.5-9Bafter training in the Gym

Why interactive spatial CAPTCHAs?

Spatial understanding is a loop

People infer the 3D layout behind a view, act on it, look at the result and correct themselves.

Conventional CAPTCHAs are solved

Frontier models pass up to 96% of ReCAP and 82% of Open CaptchaWorld puzzles.

Most spatial benchmarks never ask to act

Most use multiple-choice questions; TuringSpace has the model click and drag through 125 task types.
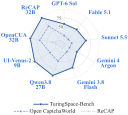
Radar chart of failure rates of nine models: high on TuringSpace-Bench, low on Open CaptchaWorld and ReCAP
Failure rate (%) of nine MLLMs on TuringSpace-Bench and two CAPTCHA benchmarks; every model fails more often on TuringSpace-Bench than on both.

Every task is a program, so the benchmark never runs out

A seed turns each task into a new puzzle with its own checker and solution. Three held-out seeds per task form TuringSpace-Bench; every other seed is training data in TuringSpace-Gym, drawn from separate asset pools and never repeating a test layout.

The reference solution of one instance per category, played in the browser one action at a time.

The best model still fails one puzzle in four
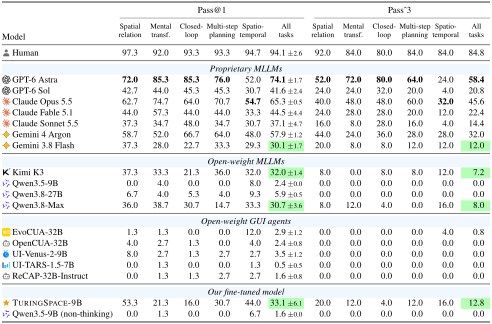
20.0ptsA wide gap to humansHumans solve 94.1% in 33 s per task, GPT-6 Astra 74.1%. Only Claude Opus 5.5 and Gemini 4 Argon also pass 50%.
58.4%Models are less consistentSolving a task on all three test instances drops GPT-6 Astra from 74.1% to 58.4%, but humans only to 84.8%.
32.0%Open models trail far behindThe best open-weight MLLM, Kimi K3, reaches 32.0%; GUI agents, even CAPTCHA-trained ones, at most 3.5%.
Pass@1 and pass^3 per category of humans, 16 MLLMs and TuringSpace-9B
Results of humans, 16 MLLMs in three groups, and our fine-tuned model, in %. Pass@1 is averaged over the three test seeds with its standard deviation, and pass^3 is the share of tasks solved on all three. Humans take 33.1 s per task on average. Green cells mark TuringSpace-9B and the three models that it surpasses in both metrics; bold marks the best score among the evaluated models.

Why models fail, and how they learn

01

Stronger models do not think more; they know where to think

GPT-6 Astra uses 75 times fewer thinking tokens than Kimi K3 per attempt, and solves 2.3 times as many tasks.

We rerun all 125 tasks on one test seed at every reasoning effort for four models, and compare the thinking tokens of ten models at medium effort.
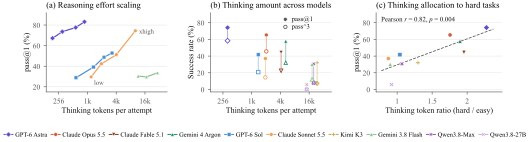
Three panels relating thinking tokens and success rate
(a) More effort helps only some models. Claude Sonnet 5.5 rises from 29.6% to 74.4% and GPT-6 Astra from 67.2% to 83.2%, while Gemini 3.8 Flash stays near 30%.
(b) More thinking is not more success. Across ten models, log thinking tokens per attempt correlate negatively with pass@1 (r = −0.75): GPT-6 Astra uses 319, Kimi K3 24,015.
(c) Strong models think on hard tasks. Thinking on the hardest over the easiest quartile of tasks tracks pass@1 (r = 0.82): 2.3× for GPT-6 Astra, at most 1.07× for three weaker models.
02

Reasoning defends a wrong belief instead of fixing it

The reasoning doubts its wrong belief in 89.4% of failed attempts, but gives it up in only 7.5%, almost always after the puzzle is already lost.

We take all 293 failed attempts on one test seed of the three models whose full reasoning is visible (Kimi K3, Qwen3.8-Max, Qwen3.8-27B). Claude Opus 5.5 finds the wrong belief that decides each failure and labels how the reasoning treats it; an author agrees with 92% of 50 sampled labels.
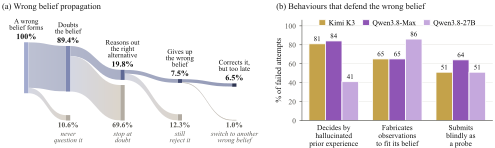
How far failed attempts get in correcting their wrong belief, and the behaviours that keep it
(a) The belief survives the doubt. It forms within the first two steps in 68% of attempts. Only 19.8% reason out the correct answer, and 36 of these 58 attempts then return to the wrong belief.
(b) Three behaviours keep it in place. The model decides by a prior it imagines (66%), reports details that the screenshot does not show (74%), or submits blindly to see what happens (55%).

Three failed attempts, in the models' own words

One case for each way the reasoning keeps the wrong belief.

03

Models click where they intend; most failures come from misreading the screen

We label 380 failed attempts of GPT-6 Astra, Claude Opus 5.5 and Gemini 4 Argon with one of ten root causes in three groups.

Perception: misread depth, orientation or detailReasoningInteraction: skipped a key frame

Closed-loop and planning tasks show a new screenshot after every action, yet perception errors still cause 85 of their 129 failures. No failure comes from clicking at the wrong place.

04

A 9B model trained in the Gym improves on all seven out-of-distribution benchmarks

We fine-tune Qwen3.5-9B with thinking off and a frozen vision encoder on 55K verified oracle trajectories of TuringSpace-Gym, with no robot data, and test it zero-shot with each benchmark's official prompt.
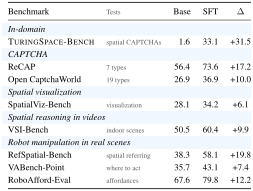
Success rate of Qwen3.5-9B and TuringSpace-9B on TuringSpace-Bench and seven out-of-distribution benchmarks
  • +31.5In domain: 1.6% → 33.1%, above Kimi K3, Qwen3.8-Max and Gemini 3.8 Flash and close to Claude Sonnet 5.5 (37.1%).
  • +17.2Spatial CAPTCHAs teach conventional ones: +17.2 on ReCAP and +10.0 on Open CaptchaWorld, while CAPTCHA-trained agents reach ≤ 3.5% on ours.
  • +19.8Real scenes: +9.9 on the room videos of VSI-Bench and +19.8, +7.4 and +12.2 on three robot benchmarks whose photos never appear in training.
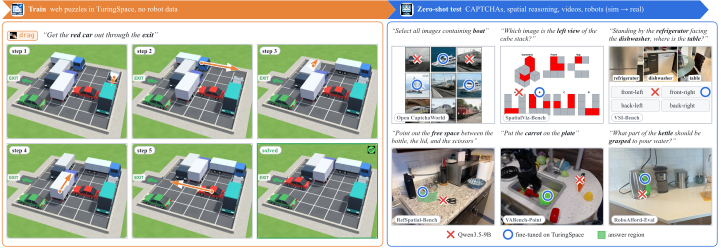
A training trajectory and zero-shot cases on other benchmarks, base model versus TuringSpace-9B
From web puzzles to real-world scenes. Left: a training trajectory, in which the model drags the blocking vehicles until the red car can leave; no robot data is used in training. Right: zero-shot cases from six other benchmarks, with the answers of Qwen3.5-9B and TuringSpace-9B and the answer region.

Cite TuringSpace

@misc{ding2026turingspacegroundingspatialintelligence,
      title={TuringSpace: Grounding Spatial Intelligence in Action with Interactive CAPTCHAs}, 
      author={Xuwei Ding and Skylar Zhai and Linxin Song and Jiarui Feng and Dongqi Fu and Huajun Xi and Junnan Li and Jingcheng Liang and Jieyu Zhao and Yinglong Xia and Hong Li and Jian Kang},
      year={2026},
      eprint={2611.25387},
      archivePrefix={arXiv},
      primaryClass={cs.LG},
      url={https://arxiv.org/abs/2611.25387}, 
}